Graph Information
Please note: this page is still under development
Options on many / all graphs
Invert Colours
Switches the colours on the graph to the opposite colours
Gray Scale (do not use on Firefox)
Makes all of the NZGrapher interface in greyscale
Size
This adjusts the size of the graph. By default it fills the size of the graph area.
| Auto | Fills the graph area completely |
| Auto - High Res | Fills the graph area completely, but the image is a high resolution image, which can be useful when printing published materials |
| Standard | 800px wide by 600px high |
| Short | 800px wide by 300px high |
| Small | 500px wide by 400px high |
Colour Scale
| Rainbow |  Goes from Red through to Purple |
| Viridis |  Goes from Purple through to Yellow (Colourblind friendly) |
Title
This is the title that ends up on the top of the graph
x-axis
This is the label that is shown next to the horizontal axis.
y-axis
This is the label that is shown next to the vertical axis.
Colour Label
This is the label that is shown next to the colour key at the top of the graph.
Show ID of Removed Points
In the top right corner shows the ID of the points that have been removed as they didn't have valid data for graphing. This is on by default.
Transparency
This slider allows you to set the transparency of the points on the graph.
About
This shows the info page about NZGrapher in the graph window (it's not really a graph).
Pairs Plot
This graph gives a quick overview of all the variables in the dataset. Note: it will not work if the first data point has any missing values.
Dot Plot (and Box and Whisker)
This graph draws dot plots and box and whisker graphs, as well as violin graphs, strip graphs, shape outline graphs and bee swarms.
Data Options
| Numerical 1 | This is the variable that is plotted against the x-axis. |
| Category 1 (Optional) | This is the variable that is used to split the data into different box plots that are plotted on the same axis. |
| Category 2 (Optional) | This is the variable that splits the graph into multiple graphs side by side. |
| Colour By (Optional) | This is the variable that the dots are coloured by. |
Summaries
Shows the summary statistics for each group including the mean, median, min, max, quartiles, standard deviation and number of points in the group.
Box Plots
Shows a box plot overlaid over the dot plot.
High Box Plot
Shows a box plot towards the top of the graph area to avoid as much as possible overlapping with the dots.
Hide Points
Hides the dots on the dot plot.
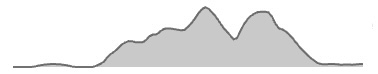
Shape Outline
Draws an overall outline of the shape of the data like this
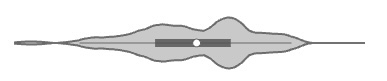
Violin Graphs
Draws an overall outline of the shape of the data in a mirror image along the centre line.
The white dot is shown at the median of the data.
The box in the middle goes from the lower quartile to the upper quartile
The horizontal line in the middle goes from the minimum to the maximum excluding outliers (no more than 1.5 times the IQR less than the LQ / more than the UQ).
Bee Swarm
Arranges the points randomly above and below the centre line so they look like a swarm of bees
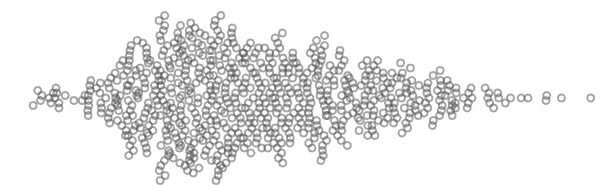
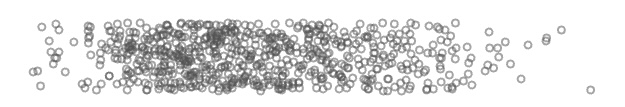
Strip Graph
Randomly puts the points within a vertical window, which makes the areas with more points look darker and less points look lighter.
Box (No Whisker)
Just plots the middle box of a box-and whisker graph
Box (No Outlier)
Plots a box and whisker graph that doesn't extend to the outliers (no more than 1.5 times the IQR less than the LQ / more than the UQ).
DBM & OVS
Displays the Difference Between Medians (DBM) and the Overall Visual Spread (OVS) when there are two groups of data.
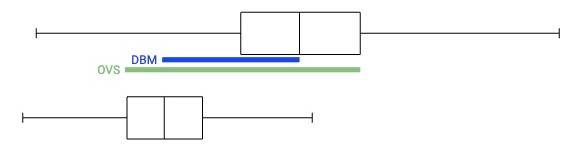
This allows students to visually see if the DBM is more than
- 1/3 of the OVS for samples of about 30
- 1/5 of the OVS for samples around 100
- 1/10 of the OVS for samples around 1000
As per the curriculum at Level 6. Read more on this at Census at School
DBM & OVS Numbers
Displays the numbers at each end the DBM and OVS lines.
½ ¾ Rule
This allows you to highlight either the bottom 1/2 and top 3/4 or the bottom 3/4 and the top 1/2 for each of the groups (when you have two groups) to make it visually easy to see if we can make a call at Curriculum Level 5.
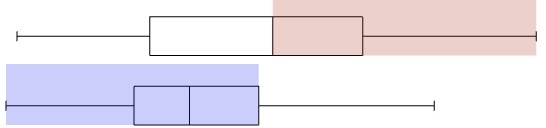
Note: This should only be used for sample sizes of between 20 and 40 in each group. Read more on this at Census at School
Informal C-I
Draws the informal confidence intervals for the median as a blue line on the graph to help students make the call at Curriculum Level 7.
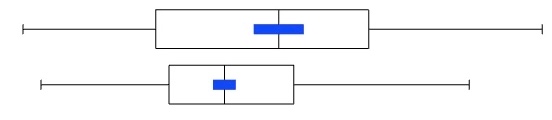
These are based on:
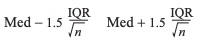
Read more on this at Census at School
C-I Limits
Displays the numbers at each end the Informal C-I lines.
C-I Highlight
Highlights above and below the informal C-I area on the graph to make it visually easier to see if they overlap.
Point Labels
Puts a number next to each of the points so you can identify which point it is in the data table.
Mean Dot
Draws a red dot on the graph where the median sits.
Stack Dots
Makes the dots all sit on top of each other in "tidy" vertical lines. This means the points may not be plotted in exactly the right location, as they are shifted slightly horizontally to allow them to stack up.
Gridlines
Draws vertical gridlines on the graph up from the axis
Thick Lines
Makes the thickness of the lines used to draw the dots much thicker.
Point Size
This slider allows you to set the size of the points on the graph.
Bar Graph
Data Options
| Category | This is the variable that become the bars. |
| Split (Optional) | This is the variable that splits the graph into multiple graphs that are stacked on top of each other. |
| Colour By (Optional) | This is the variable that the bars are split into and are coloured by. |
Summaries
Shows numbers on the bars for the frequency of each group
Allow More Categories
Allows more categories to be graphed.
Note: by default the limit is 10, which doesn't work for the sum of two dice, so this allows more categories to be graphed.
Gridlines
Draws horizontal gridlines on the graph to more easily match the axis to the bars
100% Bar Graph
Makes all the bars 100% tall (only useful when you have used the 'Colour By' option or 'Relative Width' option)
Relative Freq.
Makes all the bars add up to 1, so shows probabilities rather than frequencies
Relative Width
Makes the bars relative widths based on their frequency (only useful with the '100% Bar Graph' option)
Bar Graph - Summary Data
This is identical to the bar graph, except there is an extra option under the data so you can use summary data to draw the bar graph
| Frequency | This is the number of each category. |
Histogram
Data Options
| Numerical | This is the data that determines the buckets used on the graph. |
| Split (Optional) | This is the variable that splits the graph into multiple graphs that are stacked on top of each other. |
Summaries
Shows numbers next to the histograms with summary statistics like mean and median.
High Box Plot
Draws a box and whisker graph above the histogram
Gridlines
Draws horizontal and vertical gridlines on the graph to more easily match the axis to the bars
Relative Freq.
Changes the scale on the left from frequency to the proportion of the data that is in each bucket.
Normal Dist.
Overlays a normal distribution onto the histogram so it can be easily compared.
Rectangular Dist.
Overlays a rectangular distribution onto the histogram so it can be easily compared.
Triangular Dist.
Overlays a triangular distribution onto the histogram so it can be easily compared.
Poisson Dist.
Overlays a poisson distribution onto the histogram so it can be easily compared.
Binomial Dist.
Overlays a binomial distribution onto the histogram so it can be easily compared.
Intervals Slider
Adjusts the number of intervals displayed in the histogram
Histogram - Summary Data
This is identical to the histogram, except there is an extra option under the data so you can use summary data to draw the bar graph
| Frequency | This is the number of each category. |
Pie Chart
Scatter Graph
Grid Density Plot
Residuals Plot
Running Proportion
Bootstrap Single Variable
Bootstrap Confidence Interval - (Median or Mean)
Re-Randomisation - (Median or Mean)
Paired Experiment Dot Plot (and Arrows Graph)
Time Series
Time Series
Re-Composition
Seasonal Effects
Forecasts
Change Log
This allows you to see a list of all the changes that have been made to NZGrapher.
Update
This allows schools that are hosting themselves to show the current version of the site and update if there is a newer version available.