Function Information
This page has details on all of the menu items on NZGrapher.
Data
This menu area is about importing data into, and exporting data out of NZGrapher.
Open File
This allows you to open a file from your device. The file must be a csv. Excel files are not supported, you need to save it as a csv before uploading.
Import from Clipboard
This allows you to import data that you have already copied onto the clipboard. It needs to be copied from a table in a Google Sheet or an Excel Spreadsheet. The first time you try to use this function it will ask for access to the clipboard.
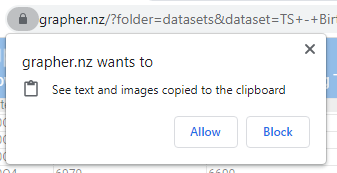
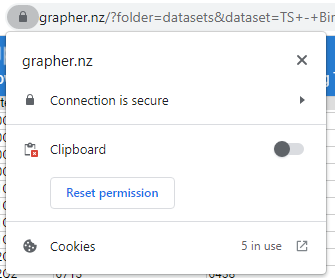
You need to press allow in order for this to work. If you press block, you can change the setting by pressing on the padlock icon and changing the toggle to on.
Paste Table (Legacy)
Some devices do not support import from clipboard. If this is the case, you can use the paste table (legacy) mode which allows you to paste in a table that you have copied from elsewhere. Note: this is slower than using the Import from Clipboard, so if you can use that, it is better.
Probability Simulation
Allows you to run probability simulations in NZGrapher with multiple events. See video tutorials for a guide on how to use.
Event Recorder
Allows you to record events as they happen (great for recording experiments) events. See video tutorials for a guide on how to use.
Open Link
This allows you to link to a csv file that is hosted on the internet.
Select and Copy Data Table
This highlights the data table and copies it to the clipboard. Useful if you want to take the data out into a report or a spreadsheet.
Download Data
This downloads a copy of the data as a .csv
Save Session
This downloads a copy of the data as well as all of the current settings as a .nzgrapher file. When you upload a .nzgrapher file it not only loads the data, but all the graph settings and displays that you had set up.
Save Current State for Reset
This sets the data in its current state as the "default" dataset, so when you press "reset" it resets back to this point.
Reset
This resets the data back to it's original state or back to where it was last time you pressed "Save Current State for Reset".
Row
Add Row
This adds a new row to the bottom of the dataset.
Delete Last Row
This removes the last row from the dataset.
Delete Last ___ Rows
Deletes the last x number of rows, gives you a prompt to ask how many rows you would like to remove.
Delete Specific Row
This deletes a specific row from the dataset (useful for removing outliers) by the point ID as shown on the left of the dataset.
Column
Add Column
Adds a column to the right of the dataset.
Delete Last Column
Deletes the rightmost column.
Delete Specific Column
Deletes a specific column.
Sample and More
Sample
Allows you to do either simple random samples, or stratified random samples.
This is also useful if you want to remove a particular section of the data... for example in the kiwi data set if you just wanted to look at GS and NiBr, you would set these to 163 and 275 respectively, and leave all the others blank and press sample.
The "Fill Numbers" button fills the categories with the total number in each group to make removing single groups easier.
View Group(s)
Allows you to easily view single or multiple groups in a particular category by ticking or unticking checkboxes.
Sort
Sorts the data table by a particular variable. This doesn't affect displays.
Reorder Variable
Allows you to prepend text (add to the start of) to a variable.
For example if you had a variable with values "N", "A", "M" and "E" and you wanted them to display in this order, you would put 1, 2, 3, 4 next to these respectively, and then it would graph in that order.
Create New Variable (From 2 Variables)
Allows you to add, subtract, multiply or divide two variables.
Create New Variable (Linear Function)
Allows you to create a new variable with an equation of y = m*x + c where x is one of the columns in the existing data set.
Create New Variable (Custom Function)
This allows you to create a new variable by putting in an algebraic function with x in in eg "1/x^2+3" and it will create a new variable from that function.
Create New Variable (From Condition)
Allows you to create "Low" or "High" variables. Conditions can be <, ≤, =, ≥, and >.
Create New Variable (Re-Group)
Allows you to regroup variables, for example if a variable has 5 groups, you can assign each group to a master group, so you have less overall groups.
Create New Variable (Average)
Creates a new variable by averaging columns.
Filter Data
Allows you to filter out numerical data, for example, only look at kiwis that weigh over 2kg.
Add Graphable Index Column
Adds a column to the start of the data that is just the id / index of the point.
Convert Time Column
Takes standard date / time fields and converts them to Seconds, Minutes, Hours or Days for graphing in scatter graphs or dot plots.
Encode Time Column
Encodes standard date / time fields into formats for use with the NZGrapher time series modules (eg: 2000M01)
Axis Options
Allows you to fix some of the axis start and end points as well as some other random settings.
Advanced Tools
Explains how to open up the menu on the right / bottom to show some of the extra tools in there.
Teaching Tools
For each of the teaching tools the best way to understand them is to watch the video tutorials.
Bootstrapping
This is for teaching how bootstrapping works.
Re-Randomisation
This is for teaching what re-randomisation does.
Sampling Variability
This is for teaching the effects of sampling and the variability of sampling.
Video Tutorials
Takes you to this website with video tutorials on how to use the teaching tools.
Save Changes
Updates any manual changes you have made to the dataset to the graph and selection boxes at the bottom of the page.
Note: this doesn't permanently change the dataset saved on the server, it only saves changes while you are on the page.
Display Explorer
Launches the display explorer which brings up a series of displays that you can make with the selected variables.
Help
Video Tutorials
Takes you to this website with video tutorials on NZGrapher.
Graph Information
Takes you to this website with information on the different graphs NZGrapher can draw.
Function Information
Takes you to this page.
Dataset Information
Takes you to this website with information on the datasets pre-built into NZGrapher.
Show Welcome
Shows the welcome splash screen with general info about NZGrapher.
Show Overlay
Shows an overlay with pointers about what each of the areas of the interface do.